
Wisconsin Counties Data Visualization by Thao Pao
COURSE: Art 448: Web & Interactive Media
MEDIUM: Website; Data Visualization
DESCRIPTION:
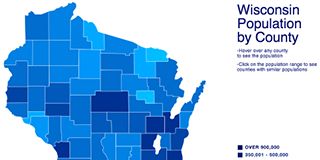
This data visualization is used to educate, inform, and engage the populations of all 72 Wisconsin counties. There are several ways of getting to see the population: by instantly hovering over any county or by clicking on a population range on the bottom right of the Wisconsin map, which you can also hover over those various counties for their population. The darker blues represent populations with more people and lighter blues with fewer people.
This project is no longer available.